FUNCTIONS AND FUNCTION NOTATION
A function is a relation between two sets in
which each member of the domain produces
only one member in the range. Sometimes
we refer the domain as input and the range as output. A function
can be represented several ways (the Rule of Four). For example:
This is a numerical representation of a function.
|
x
|
|
-5
|
-4
|
-3
|
-2
|
-1
|
0
|
1
|
2
|
3
|
4
|
5
|
|
|
y
|
|
25
|
16
|
9
|
4
|
1
|
0
|
1
|
4
|
9
|
16
|
25
|
|
|
Analytically, this function is represented
by y = x 2.
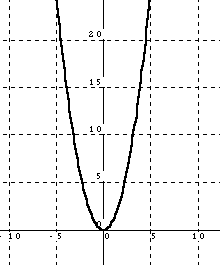
Graphically, this function is shown at right,
the familiar shape known as a parabola.
Verbally, we could write something like, each
output (value in the range) is the result of squaring its input (value
in the domain)."
|

|
| A relation is not a function if a value in the domain produces
more than one value in the range. For example, the table at right.
Here
x
= 0 resulted in two different values
of y. |
|
|
| Another
way to show whether a relation is a function is by applying the Vertical
Line Test to its graph. The idea is simple: drag a vertical
line from left to right across the graph. If, at any point, the vertical
line intersects the graph more than once, the relation is not a
function. Here's why: Every position of the vertical line represents a
value of x. If the line crosses the graph more than once, there
exists
more than one value of y associated with that value of x.
Therefore, the graph is not that of a function. The first two graphs shown below
are graphs of functions, while the second two graphs are not graphs of
functions. We could, however, argue that the third graph is a graph of x
as a function of y. If so, we would expect some clarifying information at
the outset of our study of the problem. The fourth graph (an ellipse) is
considered the graph of a relation involving x and y. |
 |
Function notation,
introduced by
Leonhard
Euler (pronounced Oiler, rather than You-ler) is
easy and convenient to use.
When we write a function f(x) = x2
- 4, we identify x as the independent variable and f(x)
or y as the dependent variable. This means,
x refers to the input of the function
f(x) refers to the output of the function
f(x) = x 2 simply
tells us that there is a function that takes x (whatever it is or
means) and does something to it. This is the left side of the equation.
The right side of the equation is the recipe itself, that is, what has
to be done to x in the function. Here, x is being squared.
Another function might be g(x) = 3x
2 + 1. Note that not all functions require the letter f.
This says that the input x is first squared, then the result is
multiplied by 3, and finally 1 is added. (Recall the
Order
of Operations). This rule is applied no matter what x
is, even if x itself is another function (this is called Composition
of Functions).
Examples:
g(5) = 3(5) 2 + 1 = 76
g(a) = 3a 2 + 1
g(2x) = 3(2x) 2 +
1 = 12x 2 + 1
g(x -
5) = 3(x - 5) 2
+ 1 = 3x 2 - 30x + 76
g(sin x) = 3(sin x) 2
+ 1 = 3sin 2 x + 1
[Note the syntax used here: the exponent comes after
the "sin". This is to avoid the possible confusion that might occur if the
exponent is placed after the x, which would mean the sine of x
squared: sin (x 2 ).]
Domain and Range.
The domain of a function is the set of allowable
numbers that may be substituted for x.
Thus, the range is the set of numbers that
result as the output of a function when every member of the domain is used
as an input.
Useful hints for finding domains and ranges:
Linear equations, power functions and polynomials
always have a domain of all real numbers unless the domain is restricted
explicitly in the problem, or implicitly by the context of the problem.
Odd degree linear equations, power functions and polynomials always have
a range of all real numbers unless the domain is restricted explicitly
in the problem, or implicitly by the context of the problem. Even degree
functions will have either a maximum or a minimum point that limits the
range of the function.
If the domain or range is not all real numbers, then
they are restricted by consideration of one of the following:
Domain: denominators cannot
equal
0
radicands > 0
argument of logs > 0
contextual restrictions
|
Range: examine graph
over the domain
sin x and cos x are always bounded by ±1
radicals > 0
contextual restrictions
|
Example: Algebraically, find the domain of  .Then,
graphically and algebraically, find the range.
Solution: This
function has a radicand that cannot be negative. So we write

Thus the domain is all real numbers less than -2 and all real numbers
greater than 2.
Finding the range algebraically
means that we are searching for any restrictions on y. So
solve the equation for x:

From this we can see that
y
2 + 4 cannot be negative. Thus y 2 >
-4. Since we are restricted to real numbers, this means that y
2 > 0, hence y >
0.
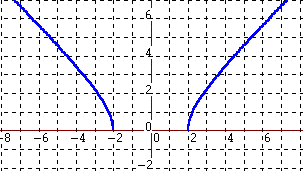
| The graph of the function reveals both of these results.
The curve lines up with every point along the x-axis except between
-2 and 2 in agreement with our statement about the domain. The graph
lines up with every point along the y-axis from 0 to infinity in
agreement with our statement about the range. |

|
Questions? E-mail me.


